Results
Warning
If a time series preparation algorithm was applied for the (main-)model, not every time-step of the model was modeled. This must be considered when analysing energy amounts. Simplifying, it can be assumed that the modeled amount of energy multiplied by the variable cost factor (see methods section) corresponds to the actual amount of energy over the entire period. Changes in the cost structure, on the other hand, are taken into account automatically.
Interactive Results
You will be automatically directed to this page after the optimization process (1) or you may want to analyze existing results (2) again.
1. Result processing after optimization process
The results differ depending on whether you used only one optimization criterion (a) or whether you did a multi-criteria optimization (b).
1a. Single-criteria optimization
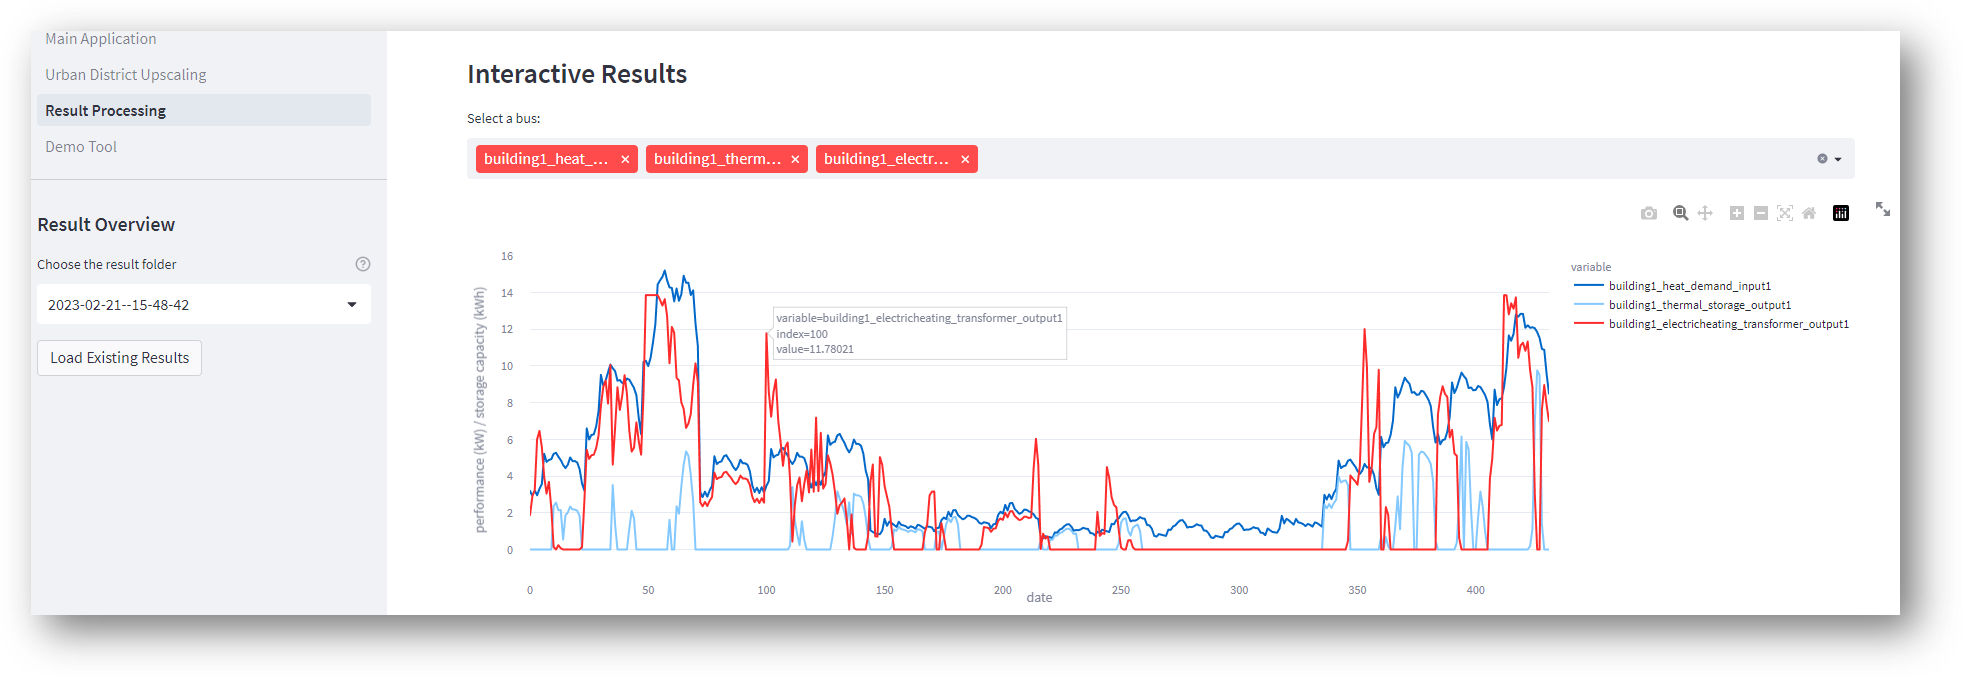
In a single-criteria optimization, the costs, emissions, and energy demands of the neighborhood are displayed. In addition, you can view the system graph and all building-specific load profiles via the interactive results.
1b. Multi-criteria optimization
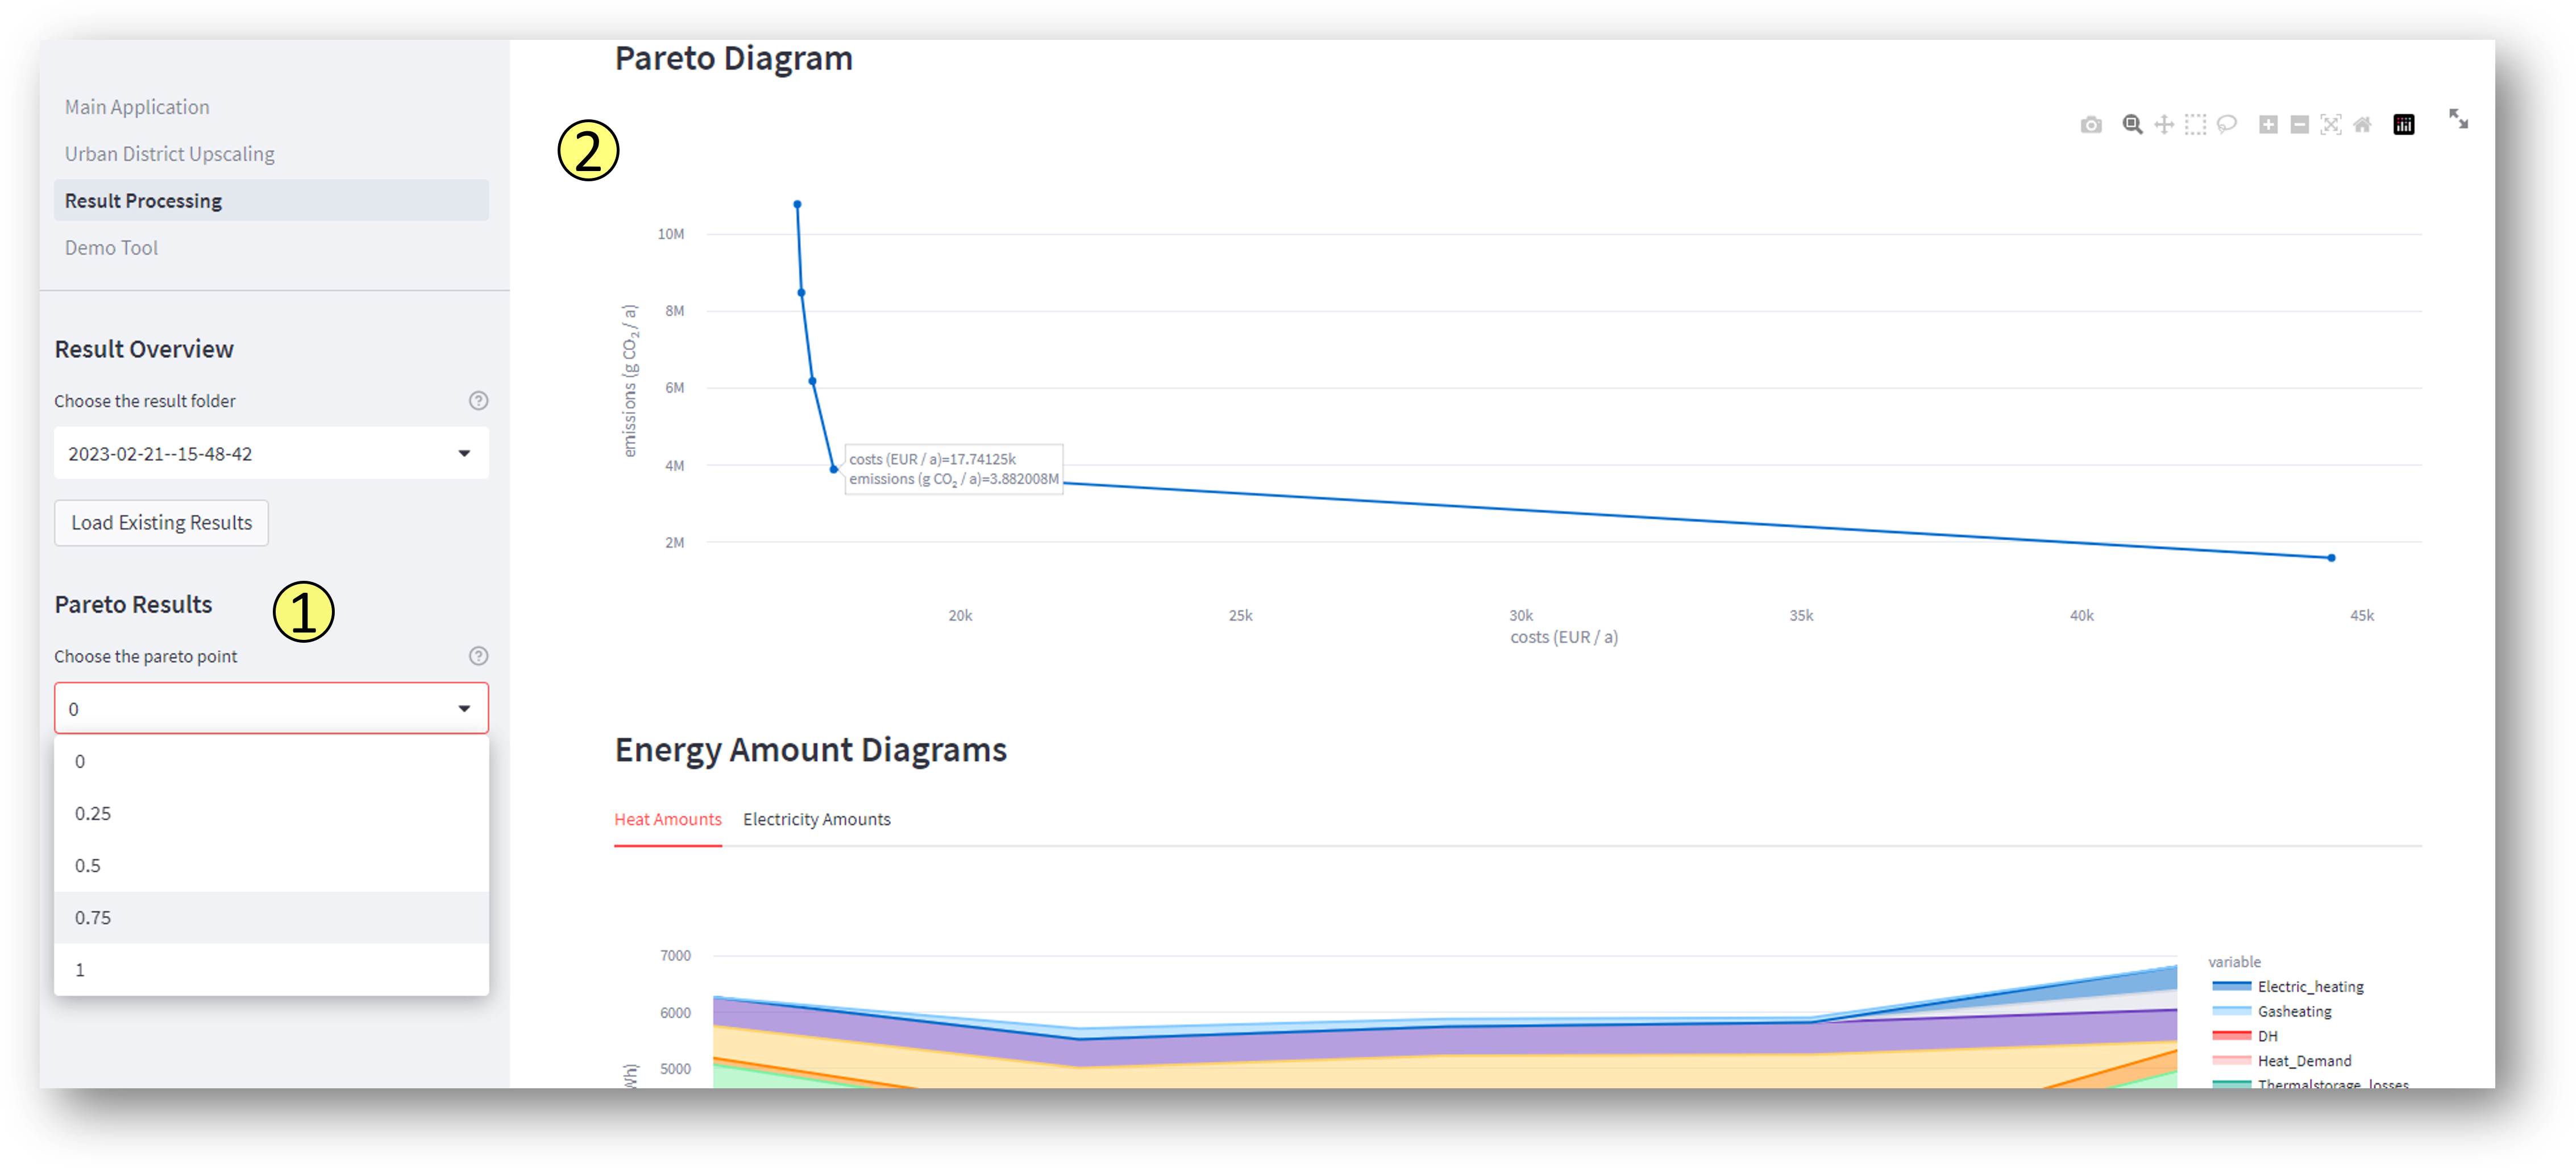
In multi-criteria optimization, several scenarios are calculated. For more information take a look at the method: Modeling Method. For each scenario, the results described for a single-criteria optimization can be displayed by selecting the reduction of the scenario (see (1) figure below). In addition, a Pareto diagram and energy amount diagrams are displayed (see (2) figure below).
2. Result processing of existing results
The difference is that you need to select a folder that you want to analyze.
Results as Spreadsheets and Log-Files
The results of the modeling are stored in the SESMG result folder which is places by default in the /users/documents/SESMG/result directory. The directory is created by the SESMG application. You can change the directory when you are using the advanced installation by following the note information in the installation description.
- The results are saved in two formats:
as summarizing log files
as detailed xlsx-files and csv-files.
The log-file gives an overview of which components are created and which of the investment options should be implemented. The other files are explained in the following chapters. If you need more specified results, feel free to contact us as we have experience with different result summaries.
1. Results for a single-criteria optimization
1a. components.csv
The components.csv file provides detailed information about all components within the modeled energy system.
ID |
type |
input 1/kWh |
input 2/kWh |
output 1/kWh |
output 2/kWh |
capacity/kW |
variable costs/CU |
periodical costs/CU |
investment/kW |
max. invest./kW |
constraints/CU |
|---|---|---|---|---|---|---|---|---|---|---|---|
ID_electricity_bus_shortage |
source |
0 |
0 |
52.91 |
0 |
0.93 |
1158.78 |
0 |
0 |
0 |
1830873.62 |
This file includes key parameters such as energy flows, capacities, costs, investments, and constraints. Below is a description of each column in the file.
input 1/kWh and input 2/kWh: These columns represent the energy flows entering the component during the analyzed time period (if a timeseries simplification is selected this column contains only the summed up energy flows for the selected time frame).
output 1/kWh output 2/kWh: These columns capture the energy flows exiting the component during the specified time period (if a timeseries simplification is selected this column contains only the summed up energy flows for the selected time frame). If multiple outputs exist the order follows the description of the flows in the model definition.
- capacity/kW:
For non-storage components: This represents the maximum energy throughput, which is typically either the highest energy output or the highest energy input, measured in kilowatts (kW) for a one-hour period (see results.csv). This capacity can be either thermal or electrical, depending on the output 1 of the component. For most components this value is identical with the investment (exception for photovoltaic and solar thermal system).
For storage components: The capacity is represented in kilowatt-hours (kWh) instead of kilowatts (kW). This value indicates the total energy storage capacity of the component.
variable costs/CU and periodical costs/CU: These costs are expressed in Cost Units (CU) and are calculated for a one-year period. If a time series simplification is applied, these costs are scaled up for the whole year.
investment/kW: The investment corresponds to the actual usable power or the nominal power of the technology in kW.
max. invest./kW: This value is derived from the model definition and represents the upper investment limit of a specific component during the optimization process.
constraints/CU: Constraints are expressed in Cost Units (CU) and are typically calculated over a one-year period. If the constraint value is negative, and it refers to GHG (greenhouse gas) emissions, this indicates the reduction of emissions due to the usage of renewable energy sources, as per “consumption-based emission accounting”. If a time series simplification is applied, these costs are scaled up for the whole year.
1b. modified_model_definition.xlsx
The modified_model_definition is a copy of the sheets of the model definition that are potentially effected by a timeseries simplification. This includes the “weather data”, the “timeseries”, the “energysystem”, the “sinks” and the “buses”. The sheets “weather data” and “timeseries” contain all information about the weather or potential timeseries for each selected time step. If no timeseries simplification is selected, data for each hour of the year (8760 time steps) is displayed here.
1c. results.csv
For all components incoming and outgoing energy flows are specified for each time step of the model in kWh. The time steps include all hours of the year chosen by the timeseries simplification (if no timeseries simplification is chosen, results for each hour of the year are displayed).
1d. summary.cvs
The summary.csv contains the most important summarized results for the entire optimization.
Start Date |
End Date |
Resolution |
Total System Costs |
Total Constraint Costs |
Total Variable Costs |
Total Periodical Costs |
Total Energy Demand |
Total Energy Usage |
|---|---|---|---|---|---|---|---|---|
01.01.2012 |
05.01.2012 23:00 |
h |
4295.21 |
5481898.26 |
2736.69 |
1558.52 |
861.77 |
209.21 |
Total System Costs: The total costs over the course of a year, representing the sum of all variable costs (Total Variable Costs) and periodical costs (Total Periodical Costs).
Total Constraint Costs: The total constraint-related costs over the year (in the unit of the chosen constraint).
Total Variable Costs: Costs that vary depending on the energy quantities (these costs are not longer variable costs as they are already summed up for the whole year).
Total Periodical Costs: The sum of all periodical costs accumulated over the year.
Total Energy Demand: The demand represents the total amount of energy required by the various components of the energy system. In particular, the energy demanded by sinks (consumers) is recorded here (This value is not summed of for the entire year if a timeseries simplification is selected).
Total Energy Usage: The usage represents the amount of energy provided by the sources (Sources) in the system to meet the demand. Additionally, excess energy (Excess) is subtracted from Total Usage to reflect the actual energy consumption (This value is not summed of for the entire year if a timeseries simplification is selected).
1e. flow_information.cvs
The flow_information.csv file provides a detailed description of all flows listed in both the components.csv and the result table displayed in the GUI. It contains the name of each flow associated with each component, making it possible to distinguish between the different inputs and outputs (columns: Flow Input 1, Flow Input 2, Flow Output 1, Flow Output 2). For example, it becomes clear which input of a heat pump is associated with electricity.
2. Results for a Single-criteria optimization with district heating
If district heating is included in the optimization options additional result files are created.
The consumers_exergy and consumers_anergy files contain the consumers that are connected to the exergy or anergy network.
The producers_exergy and producers_anergy files contain the producers that are connected to the exergy or anergy network.
The files pipes_exergy and pipes_anergy contain the pipe sections of the energy and anergy network. The length of the pipes is included, as well the information which forks are connected.
The files forks_exergy and forks_anergy contain information abourt the coordinates of the forks of the networks. Forks are the junctions of the heat networks.
The file district_heating.jpeg provides a 2D view of the designed heating network. You can see the distribution network, the house connection pipes, the forks, consumers and producers.
3. Multi-criteria optimization
If a multi-criteria optimization is chosen each optimization run is saved with its specific results under the name of the model definition with the percentage of the constraint (0 for cost optimization, between 0 and 1 for the different Pareto points and 1 for the constraint cost optimization). The model_definitions with the constraint of the different runs (between 0 and one) are saved. Additionally, the following results are summarized for the different runs:
3a. elec_amounts.csv
This file contains the electricity amounts of the different optimization runs. The column “reductionco2” indicates the Pareto run, the “Electricity Demand” represents the total demand over the period of one year and the other columns represent the electricity outputs of the different components of the energy system. The unit of the electricity amounts is kWh.
3b. heat_amounts.csv
This file contains the heat amounts of the different optimization runs. The column “reductionco2” indicates the Pareto run, the “Heat Demand” represents the total demand over the period of one year and the other columns represent the heat outputs of the different components of the energy system. The unit of the heat amounts is kWh.
3c. pareto.csv
The file contains the summarized Total System Costs and Total Constraint Costs from the summary.csv of each run and is also used to display the Pareto front in the GUI.