Demo Tool
With the help of the demo tool a descriptive introduction to energy system modeling can be given. The demo tool has been implemented for training and academic purposes and is not intended for the actual analysis of a real energy system.
Users have the possibility to integrate different energy supply technologies into a defined municipal energy system. The objective is to configure the technologies in such a way that either the monetary costs of the entire system and/or the carbon dioxide emissions are reduced.
The tool offers two modes of operation:
In Simplified Mode, users can choose the technology capacities through percentage sliders, making it accessible for non-technical users or teaching purposes.
In Advanced Mode, users can enter exact values for each technology, select optimization solvers, and define the optimization criterion (costs or emissions), allowing for more in-depth exploration.
Once a scenario is defined, the demo tool simulates the resulting energy system and compares it graphically with pre-calculated optimized scenarios. In addition to showing the Pareto front, the visualization includes key reference points such as:
MC: Minimum Costs
ME: Minimum Emissions
P1, P3, P5, P7, P9: Selected Pareto-optimal trade-off points
These markers provide a clearer understanding of the compromises between environmental and economic performance. The user-defined solution is placed in this context, highlighting its relative performance. All results can be exported for further use.
Instruction


User Interface of the Demo Tool
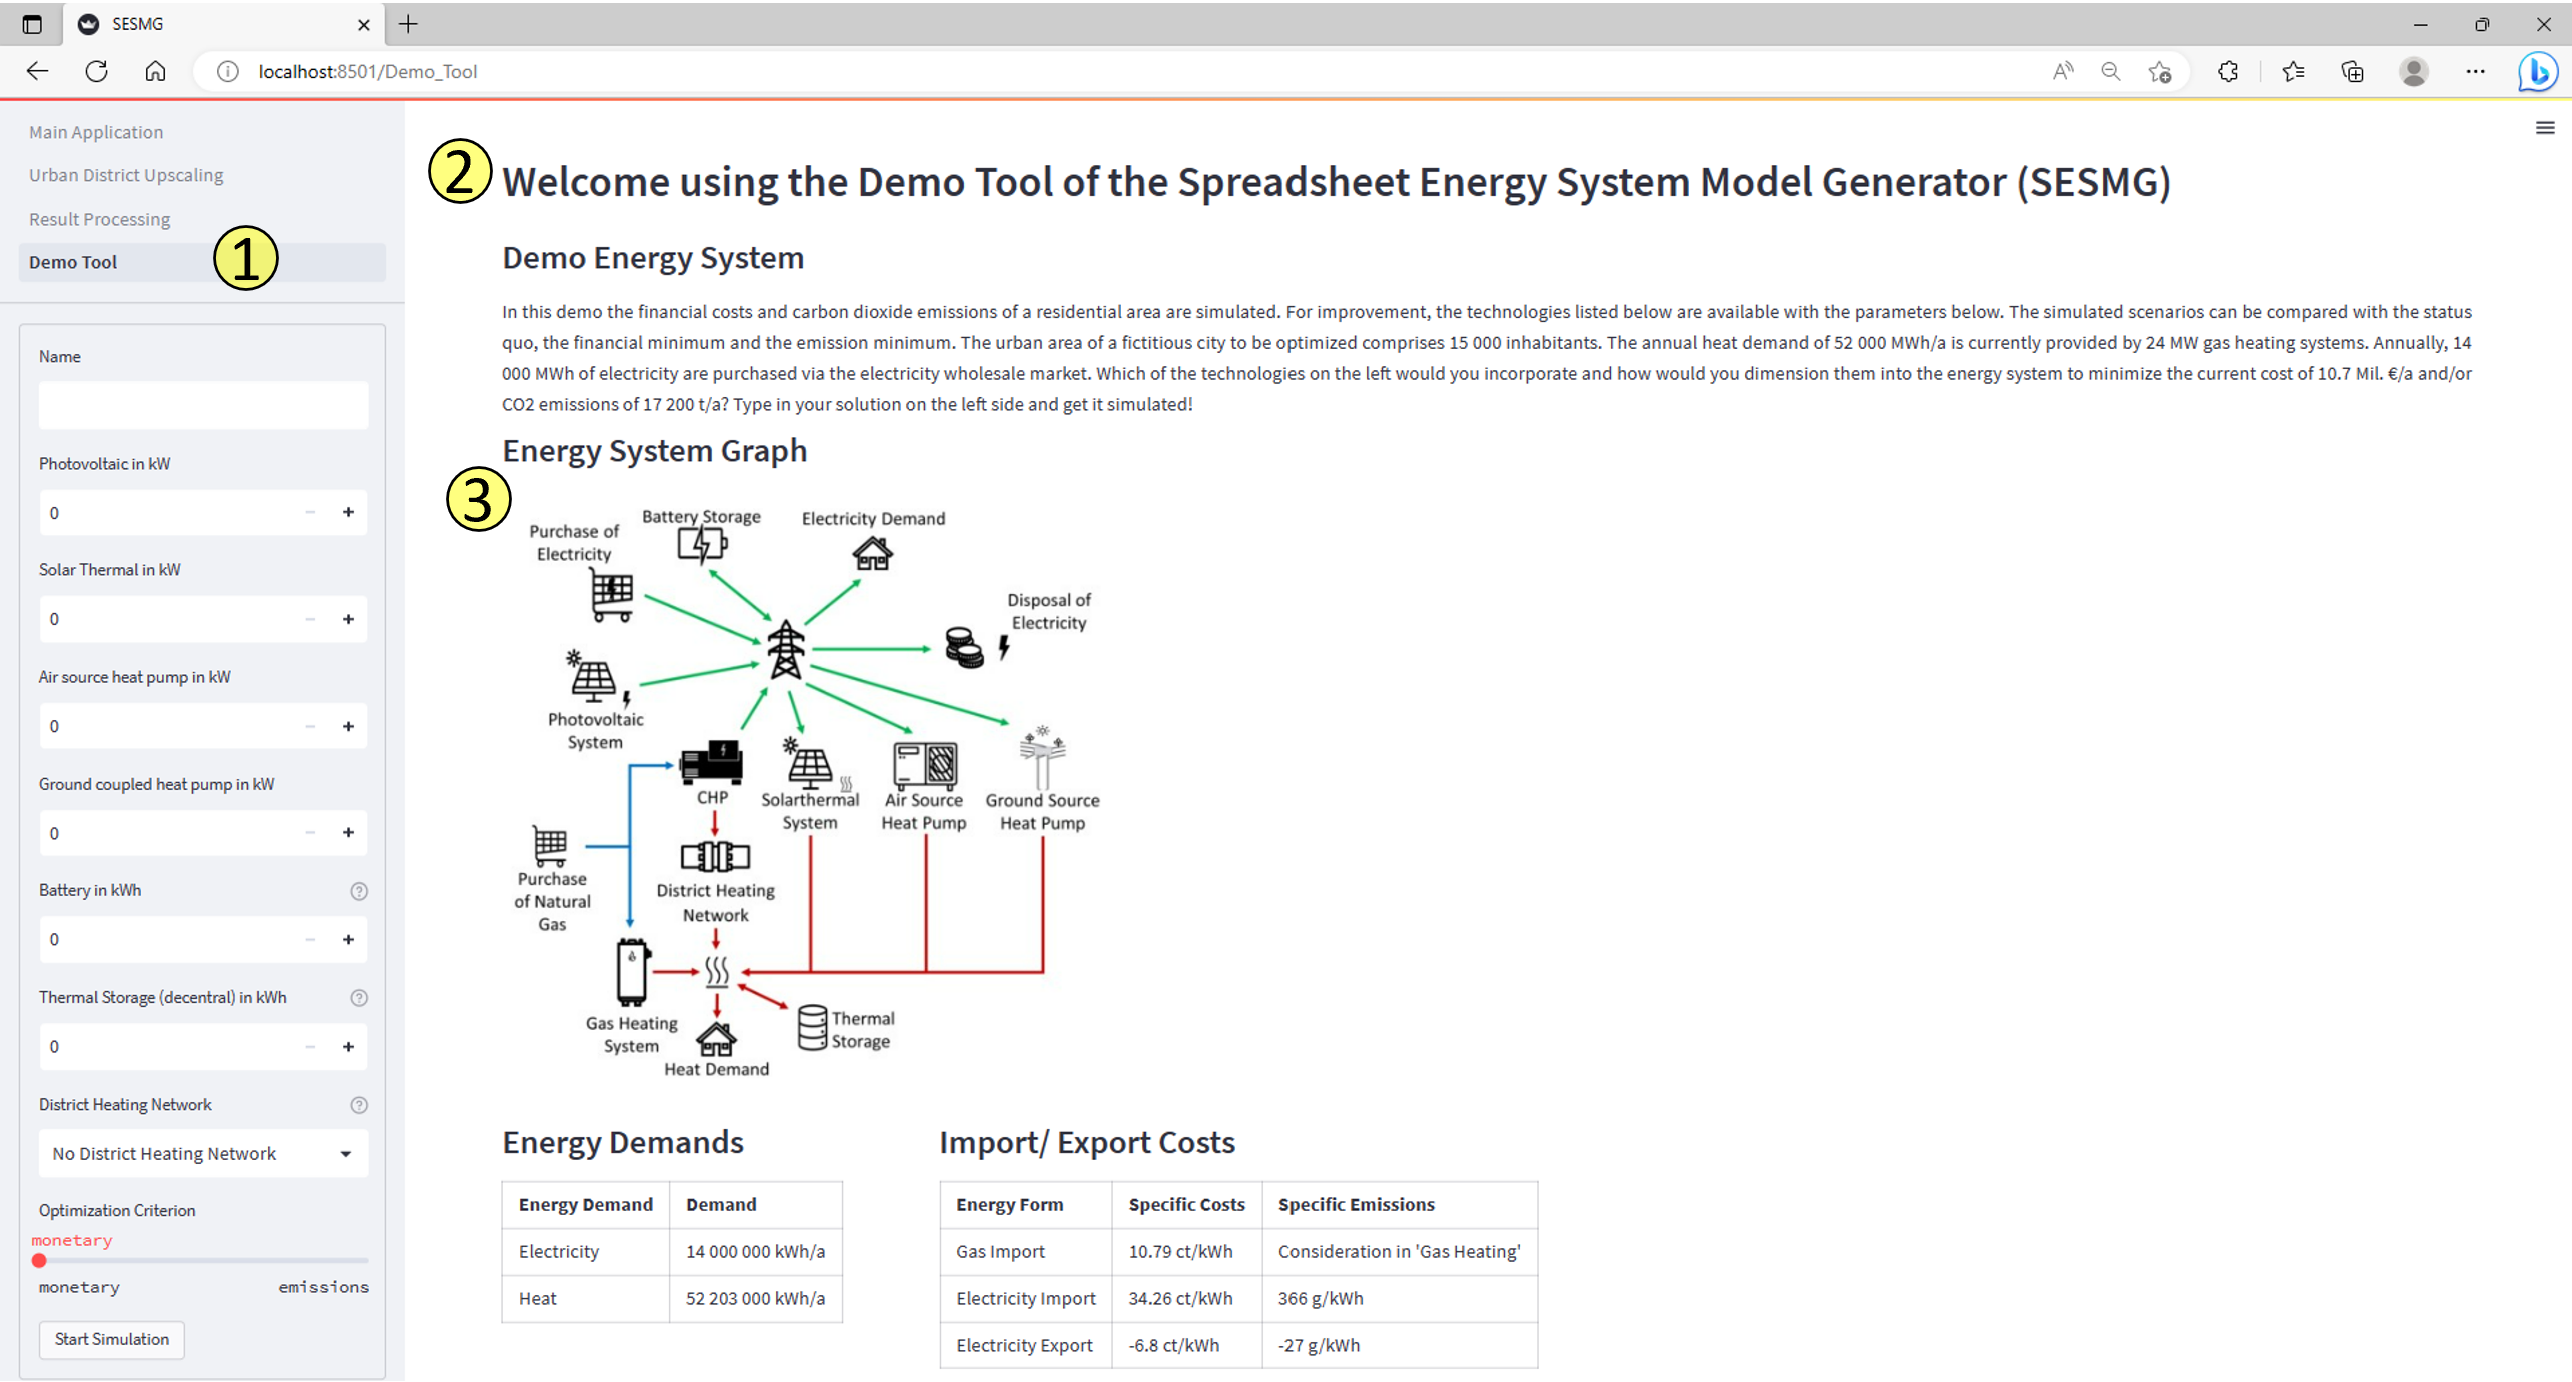
1: Tab to select the demo tool.
2: Information is given about the fictional scenario specifying the kind of district.
3: Overview of the system, the possible technologies one can use, the energy demands and import/export costs.
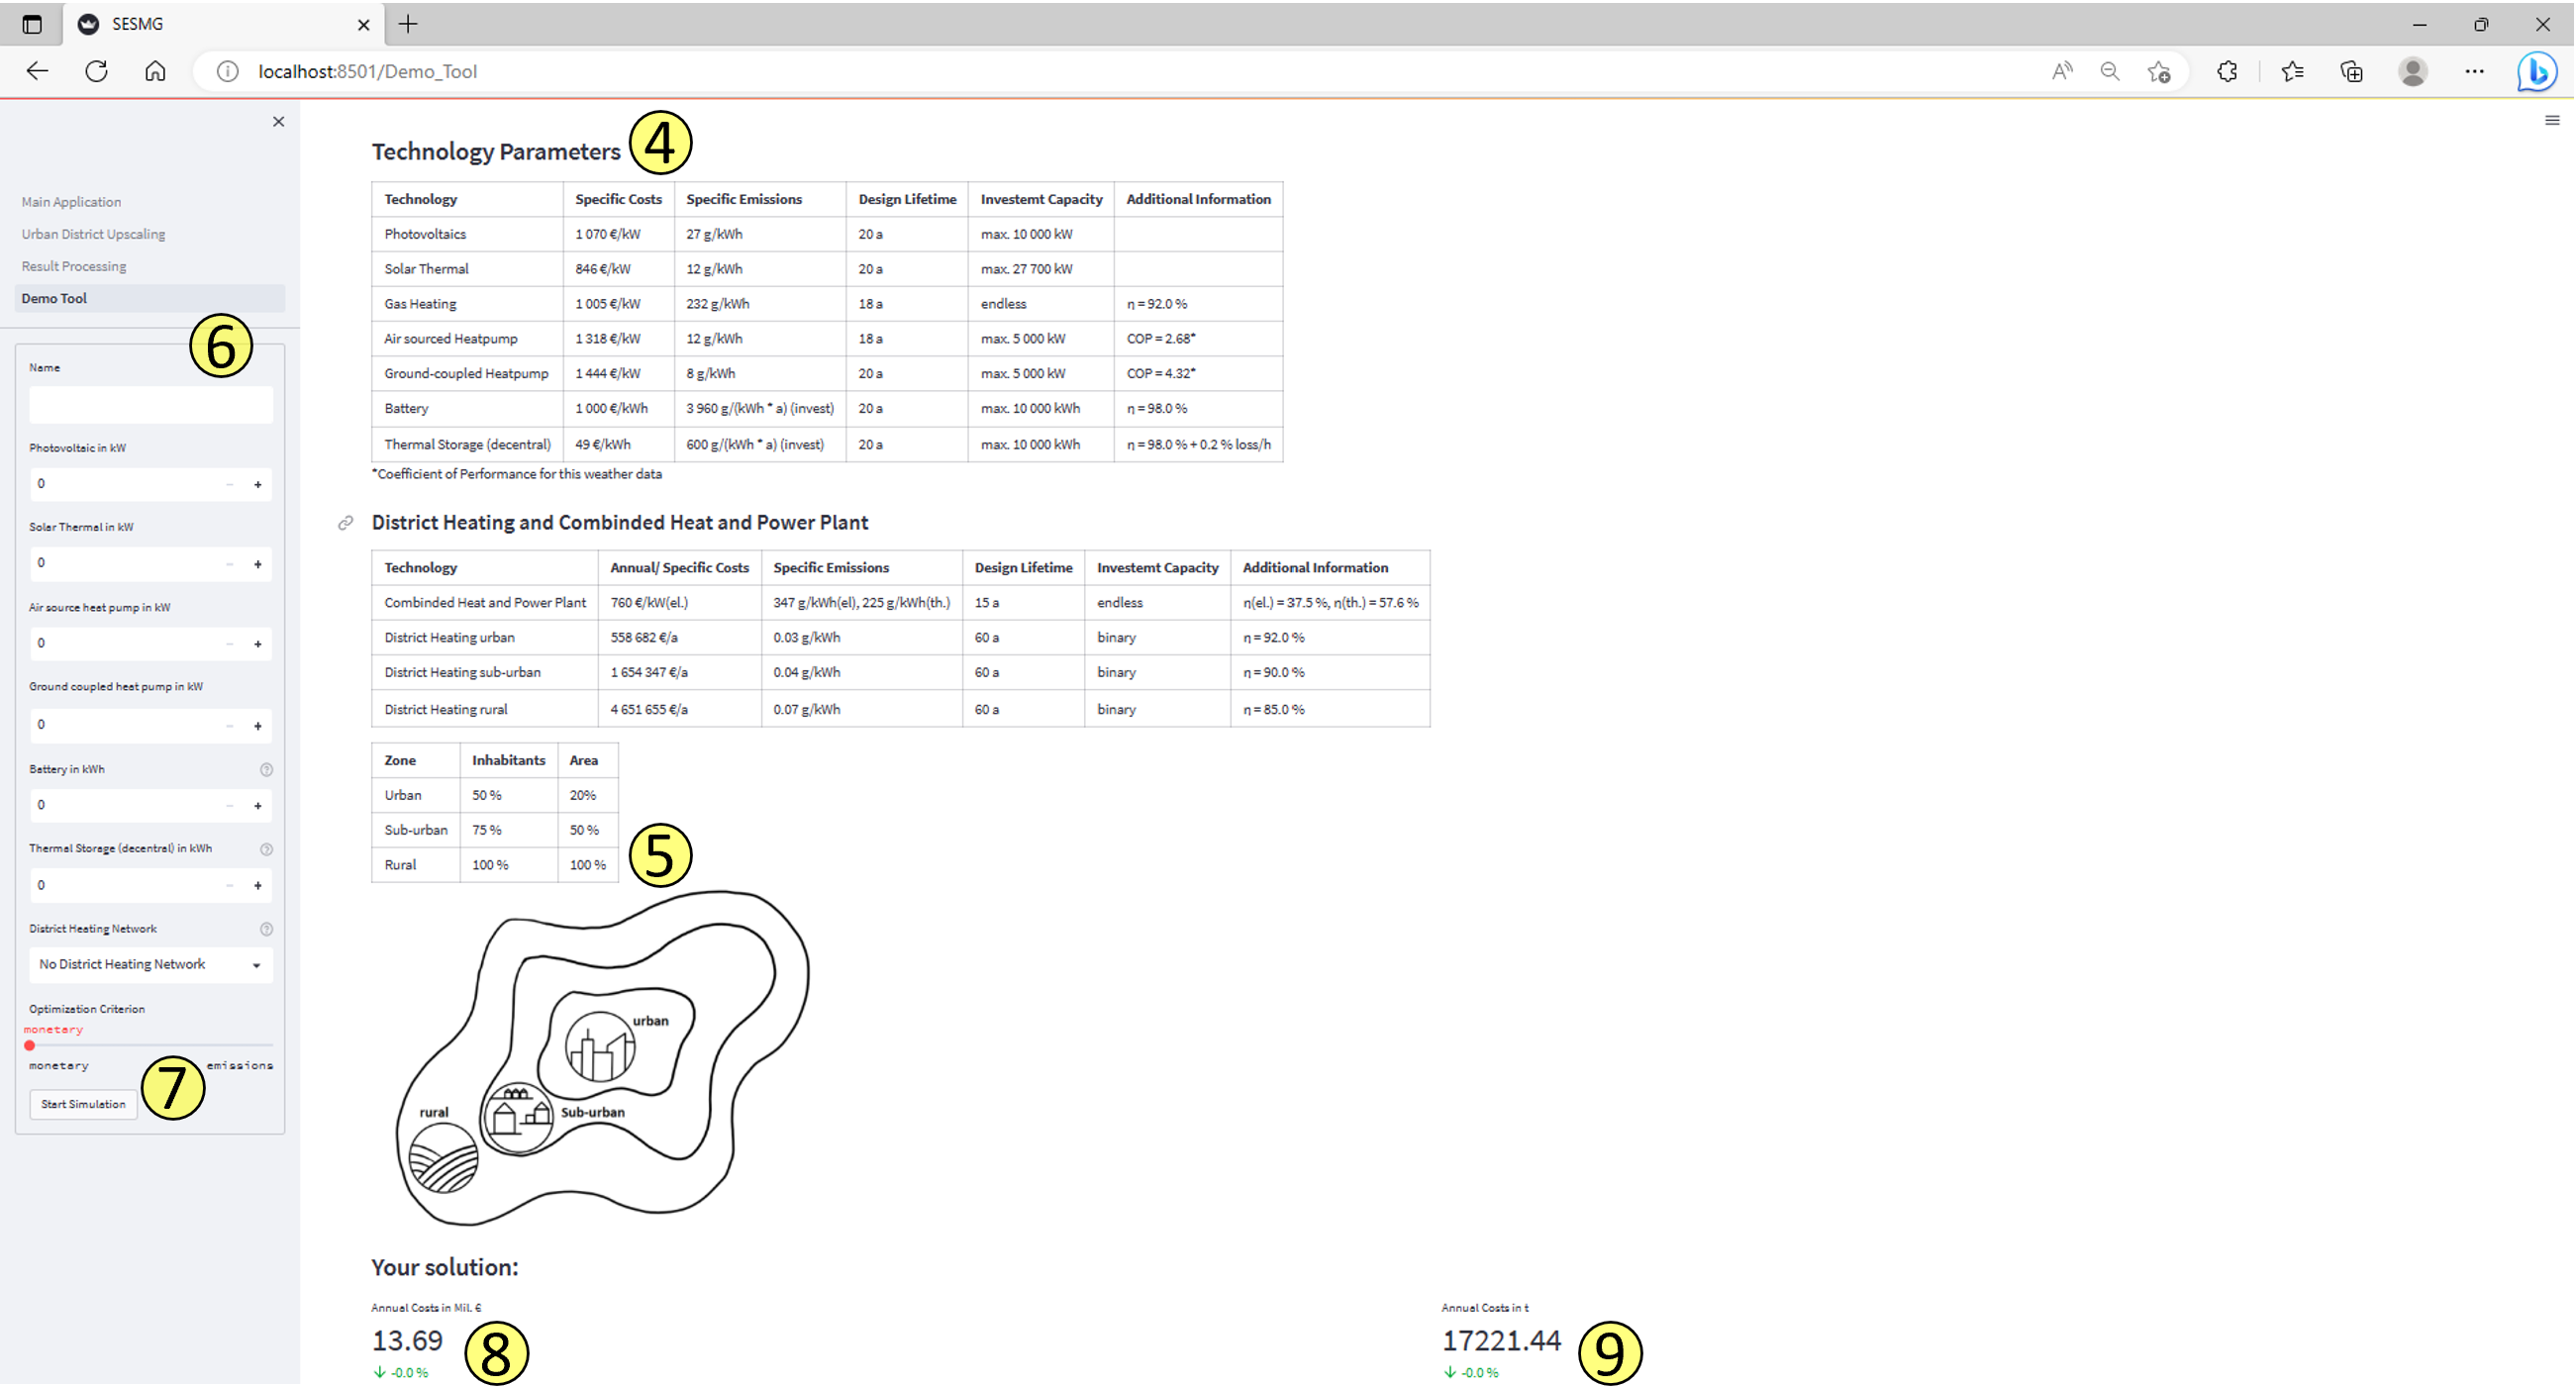
4: Overview of the technology parameters.
5: Design of the various district heating network alternatives.
6: Input of the system components to define an energy system to be simulated.
7: Start of the simulation after designing the system components.
8: Annual monetary costs of the defined energy system as well as the relative difference to the status quo.
9: Annual greenhouse gas emissions of the defined energy system as well as the relative difference to the status quo.
10: Selector to choose between Advanced or Simplified mode for user interaction.
11: Pareto graph showing the trade-off between annual costs and CO₂ emissions.
12: Table displaying ideal configuration data for each Pareto point.
13: Options to export results, reset the Pareto graph, or show/hide the result table.